Reading Time: 7 Minutes
My Research Question was to find whether basic/high level questions can be answered using certain sections or pages of the source. For this project, I have decided to experiment in the medical field by operating of medical research papers. I have chosen questions to be answered from domain of Osteosarcoma, Endocarditis, Gastroenteritis, OCD and Ophthalmoparesis.
RAG systems require access to reliable and quality data to answer context relevant queries. So by answering the research question, we can confirm that be embedding and storing certain sections of source PDF can save memory and answer with similar accuracy as full data embedding.
The domains enlisted above were randomly selected from analyzing the Medical QA dataset. This is the architecture diagram of this project.
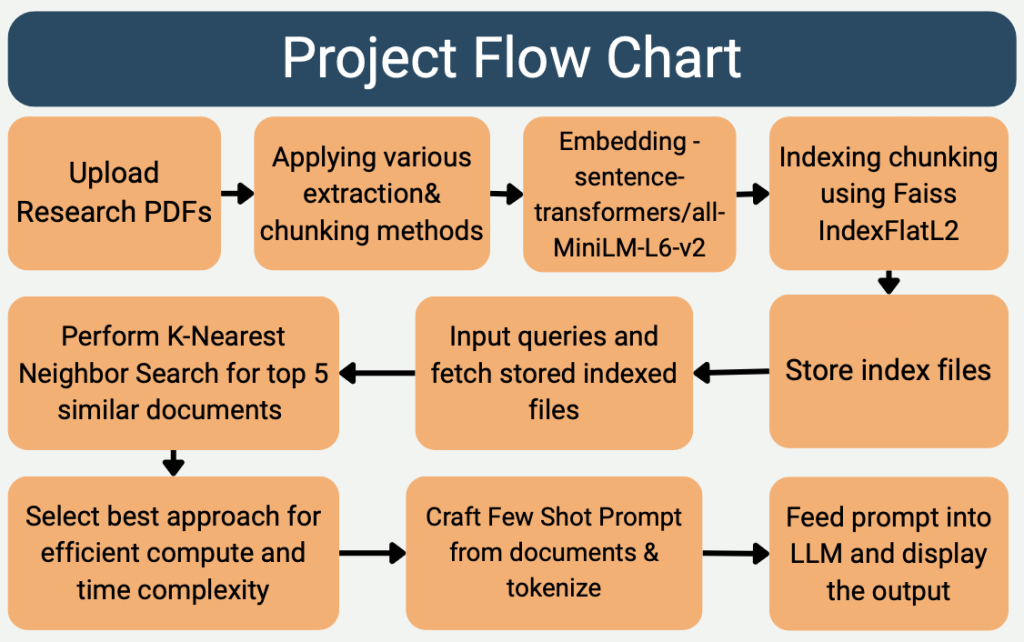
Technologies/libraries used for this project:
- BERT’s embedding from sentence-transformers – sentence-transformers/all-MiniLM-L6-v2
- Indexing using FAISS library – using IndexFlatL2. Searching method – K-Nearest Neighbor Search based on L2 distances of the query and embedded vectors.
Methodology – The data was cleaned by removing empty spaces, special characters and chunked into 512 sized windows, which is embedded using sentence- transformers/all-MiniLM-L6-v2 with float32 precision.
- Method 1: Full indexing of the PDF by embedding all content
- Method 2: First page indexing – embedding content in first page.
- Method 3: First and Last page indexing – embedding content in first and last page before references.
- Method 4: Random page indexing by embedding the content.
But before performing any statistical tests for finding significance in performace, time or storage advantages, we need to check how similar the l2 distances of the various methods are close to method 1: Full indexing of the PDF by embedding all content.
So for a high level visual analysis, bar plots of the L2 distance for each respective methods can be plotted. This is a plot of the top 5 documents reqtrived for a query from the medical QA dataset.
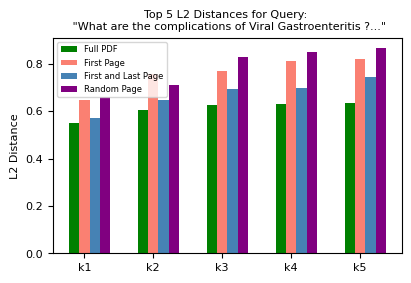
This setup was run for all the 5 diseases, there was 28 questions related to them and each had a similar graph generated. Though First and Last Page indexing looked similar to Full PDF indexing documents in terms of L2 distances, we have to perform a statistical test to confirm its similarity and then further analyze the other metrics.
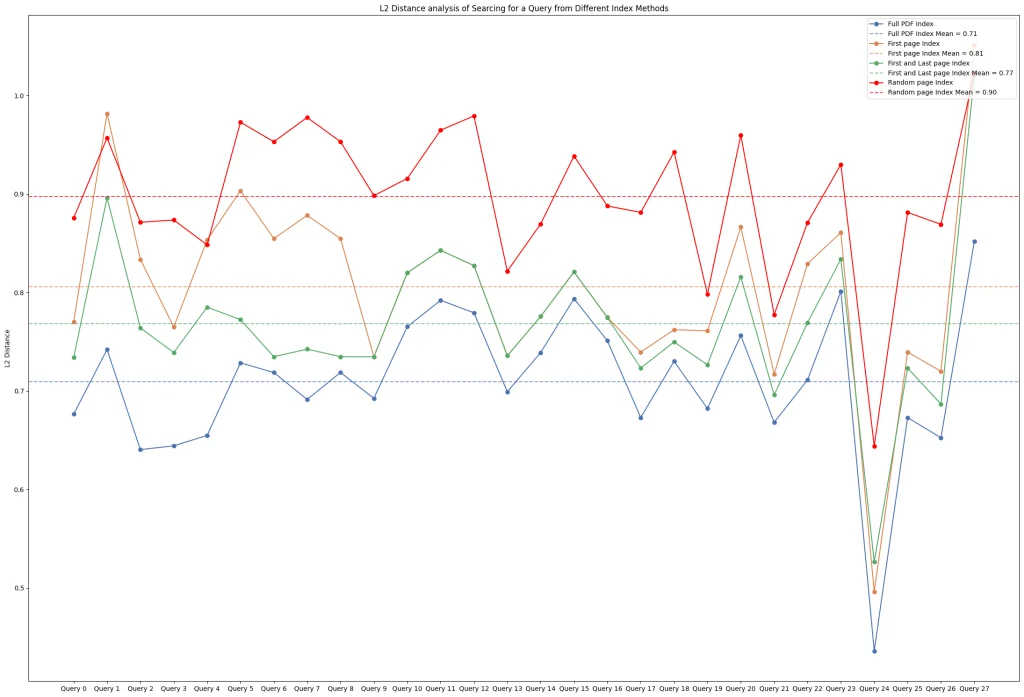
If we were to identify differences in a visual graph for varying L2 distances for different queries, it becomes practically not feasible. This is a graph of L2 distances for each method amongst all 28 queries.
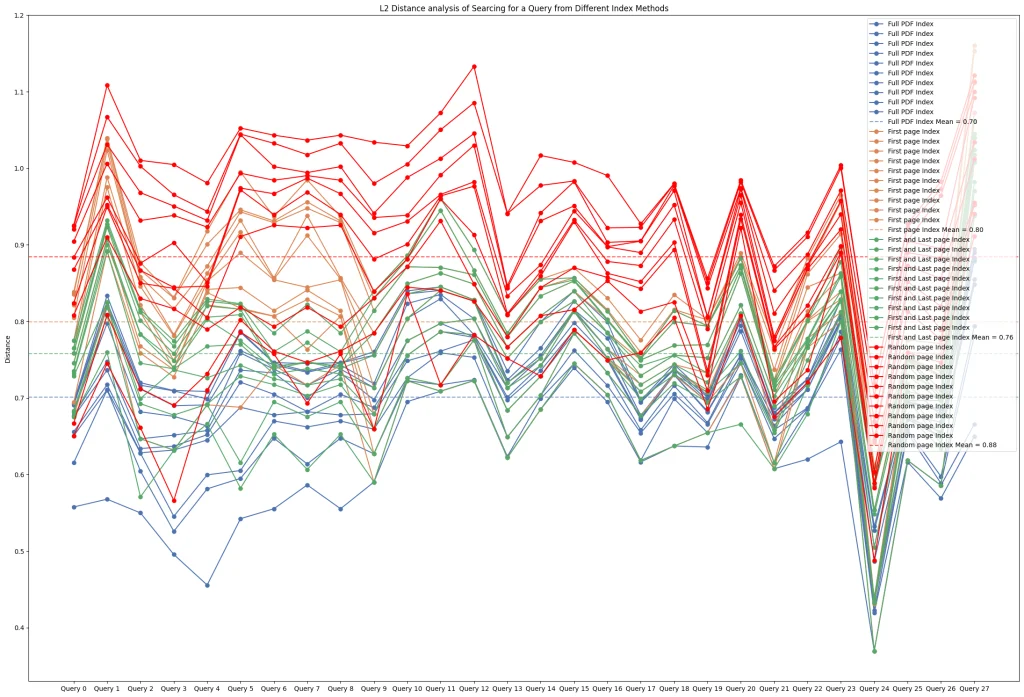
Since, a statistical test cannot be run on such high dimensions, in this experiment, I have taken the median for each method among all queries to be further used for testing. A visualization of this implementation is plotted below-
To learn more about non-parametric statistical testing – check out this resource on youtube, I found this video to be very helpful during my research.
Since, the data for each experiment is not normally distributed, regular statistical tests such as T-test cannot be performed, so a non-parametric test – Wilcoxon Signed Rank Test is used for this experiment.
Here’s a quick guide to interpret results from Wilcoxon Signed Ranked Test:
- Wilcoxon’s W = 0 means: Every paired difference has the same sign, or All nonzero differences skew in one direction.
- If median difference is positive (A − B > 0) Function A is consistently slower than Function B across all inputs. If negative then vice-versa.
- The median difference is how much time on avaerage does A take longer than B, and since the distribution is not normal here, the 95% confidence interval informs the range in which the how much time it takes longer.
- Higher r values indicate that there is statistical difference
Wilcoxon Signed Ranked Test for L2 distances amongst different methods-
| L2 Distance Analysis | Full PDF index and first page index | Full PDF index and first & last page index | Full PDF index and random page index |
| W statistic | 0.0 | 0.0 | 0.0 |
| p-value | 0.00000001 | 0.00000001 | 0.00000001 |
| Z-score | -4.62259895 | -4.62259895 | -4.62259895 |
| Effect size (r) | -0.87358909 | -0.87358909 | -0.87358909 |
| Median difference | -0.06702942 | -0.04915783 | -0.20190772 |
| 95% CI | [-0.11941817, -0.05278003] | [-0.05614838, -0.03664052] | [-0.21047279, -0.16633226] |
Since lower distances indicate better similarity to query, a negative median difference (A − B) means Function A produced more accurate and similar documents to the query, while a positive difference means Function B performed better. Here the closest median difference to the Full PDF indexing is First & last page indexing.
So now that we have a solid result to potentially leverage for high level question answering, we can check for how advantageous this method can be in terms of saving compute, time and memory. Here’s a plot of the metrics based on running the function on all queries at once for each method.
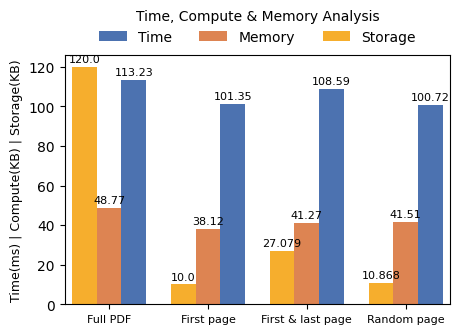
The storage has been transformed with min max scaling and a floor value of 10 to fit inside the graph and for ease of visualization.
Here, we can see significant differences in storage, and some significant differences in time, but the test is performed in all of them to identify significant changes.
As before, a simulation for each queries can be visualized on a graph, but we can’t get much information to make a conclusion about the methods in it.

Apart from full page indexing, whose time difference is clearly seen, first and last page indexing looks like it is higher than the other 2, but performing a statistical test reveals that first and last page indexing is the best amongst all methods. The results are shown below.
| Time Analysis | Full PDF index and first page index | Full PDF index and first & last page index | Full PDF index and random page index |
| W statistic | 1.0 | 22.0 | 0.0 |
| p-value | 0.00000001 | 0.00000399 | 0.00000001 |
| Z-score | -4.59982753 | -4.12162764 | -4.62259895 |
| Effect size (r) | -0.86928569 | -0.77891441 | -0.87358909 |
| Median difference | 0.00049067 | 0.00027138 | 0.00042240 |
| 95% CI | [0.00025236, 0.00058290] | [0.00014382, 0.00039341] | [0.00021762, 0.00052817] |
1. Fastest (least time): Case 2 – extracting only the first & last page for indexing – Median time = 0.00027138 (smallest)
2. Second fastest: Case 3 – extracting a random page for indexing – Median time = 0.00042240
3. Slowest: Case 1 – extracting only the first page for indexing – Median time = 0.00049067
A similar analysis for compute, yields this graph, here its even worse as all the lines are getting merged here, so a statistical test is definetly required.

| Compute Analysis | Full PDF index and first page index | Full PDF index and first & last page index | Full PDF index and random page index |
| W statistic | 155.0 | 129.0 | 88.0 |
| p-value | 0.83879289 | 0.54601735 | 0.20906188 |
| Z-score | -0.20180184 | -0.60000000 | -1.24992753 |
| Effect size (r) | -0.04036037 | -0.12247449 | -0.26648545 |
| Median difference | -0.02343750 | -0.01171875 | 0.00000000 |
| 95% CI | [-0.02343750, 0.02392578] | [-0.02343750, 0.04785156] | [-0.02343750, 0.04785156] |
Here all the p-values is greater than 5% or 0.05 so the results are not statistically significant.
Conclusion: First and last page indexing is similar to full pdf indexing with significantly lower memory usage with faster time in document retrieval.
I can conclude that basic/ high level questions from research papers can be answered with minimal indexing memory and time using first and last page indexing in RAG systems.
For future works, This framework can be experimented in different domains with different chunking methods. And various indexing methods from the FAISS documentations can be tested.
Click here to view the references for this project in a google doc.
Thank you for reading along, do post your thoughts and suggestions in the comment section below. Follow and subscribe to sapiencespace for more such insights.
Link to AI and Data Science related posts: https://sapiencespace.com/data-science-programming/
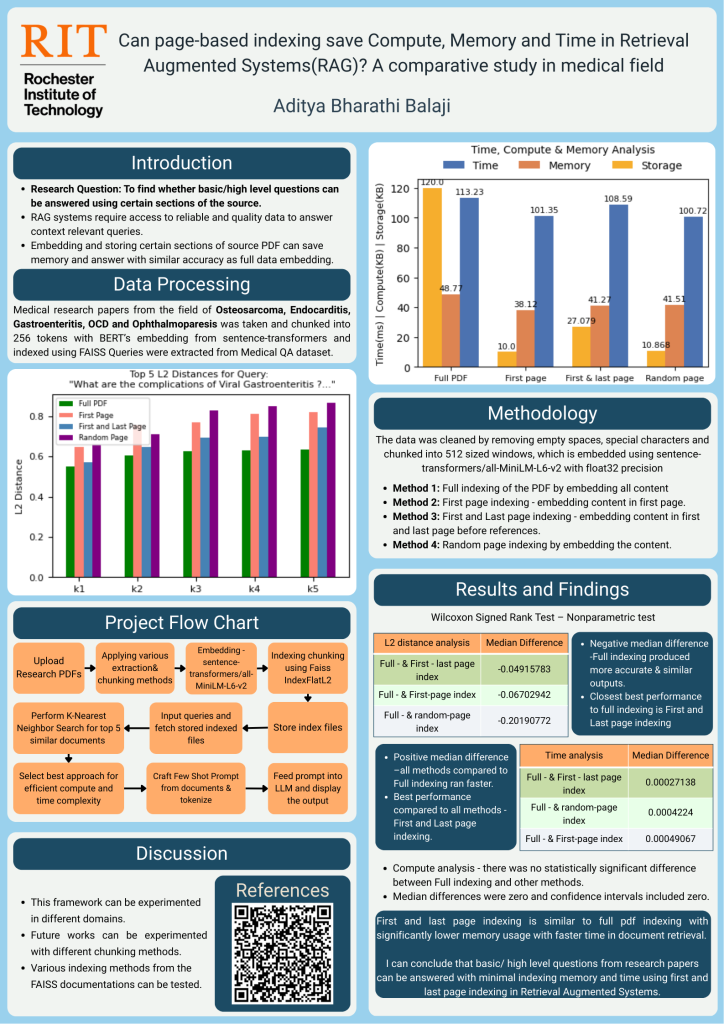
This is a poster explaining the ideas in this in one picture-